Empowering Your Trading Decisions with Real-Time Market Insights.


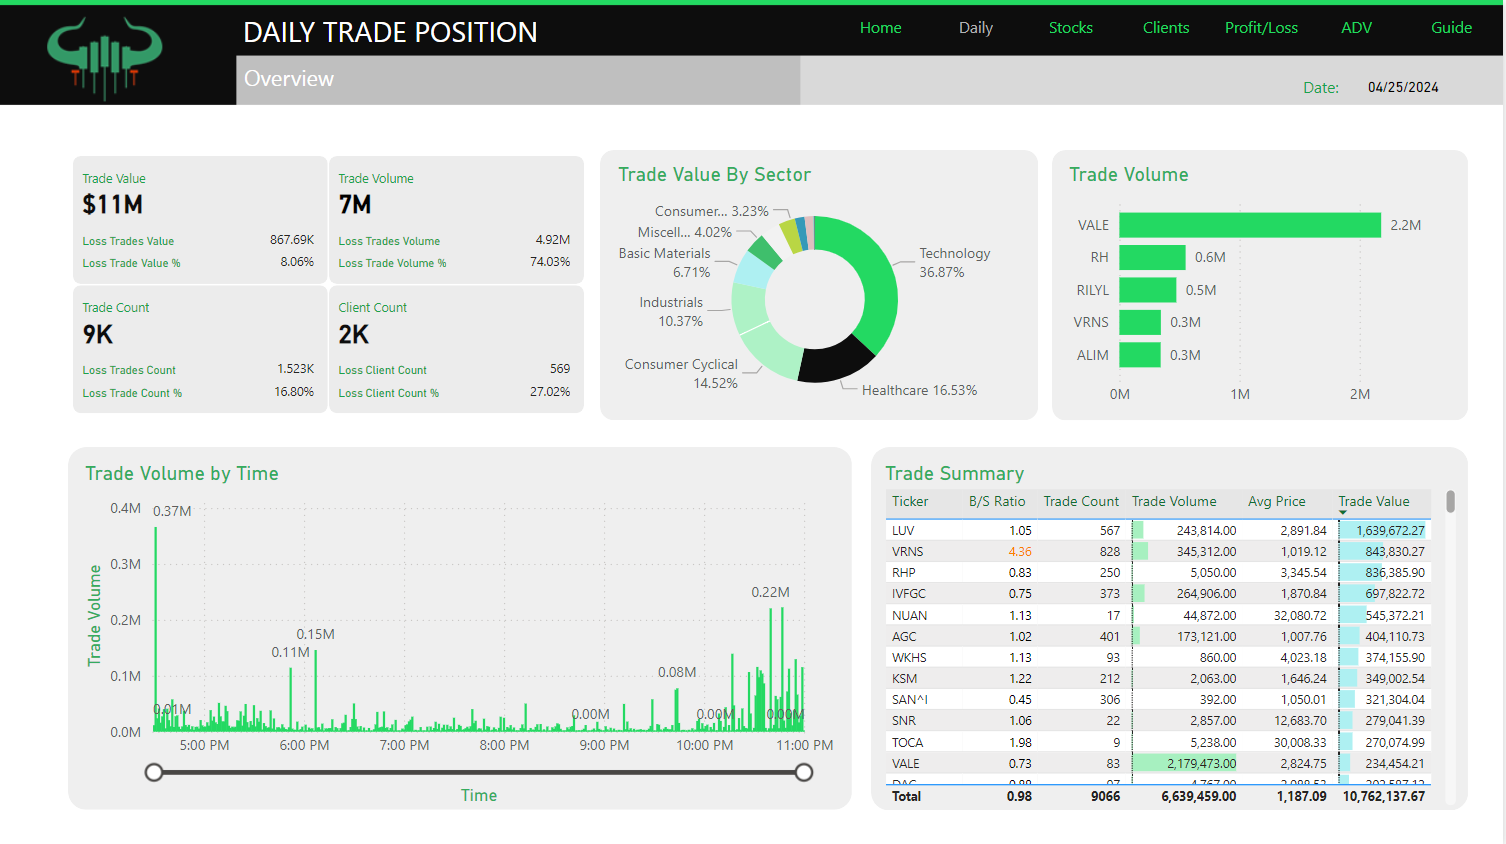
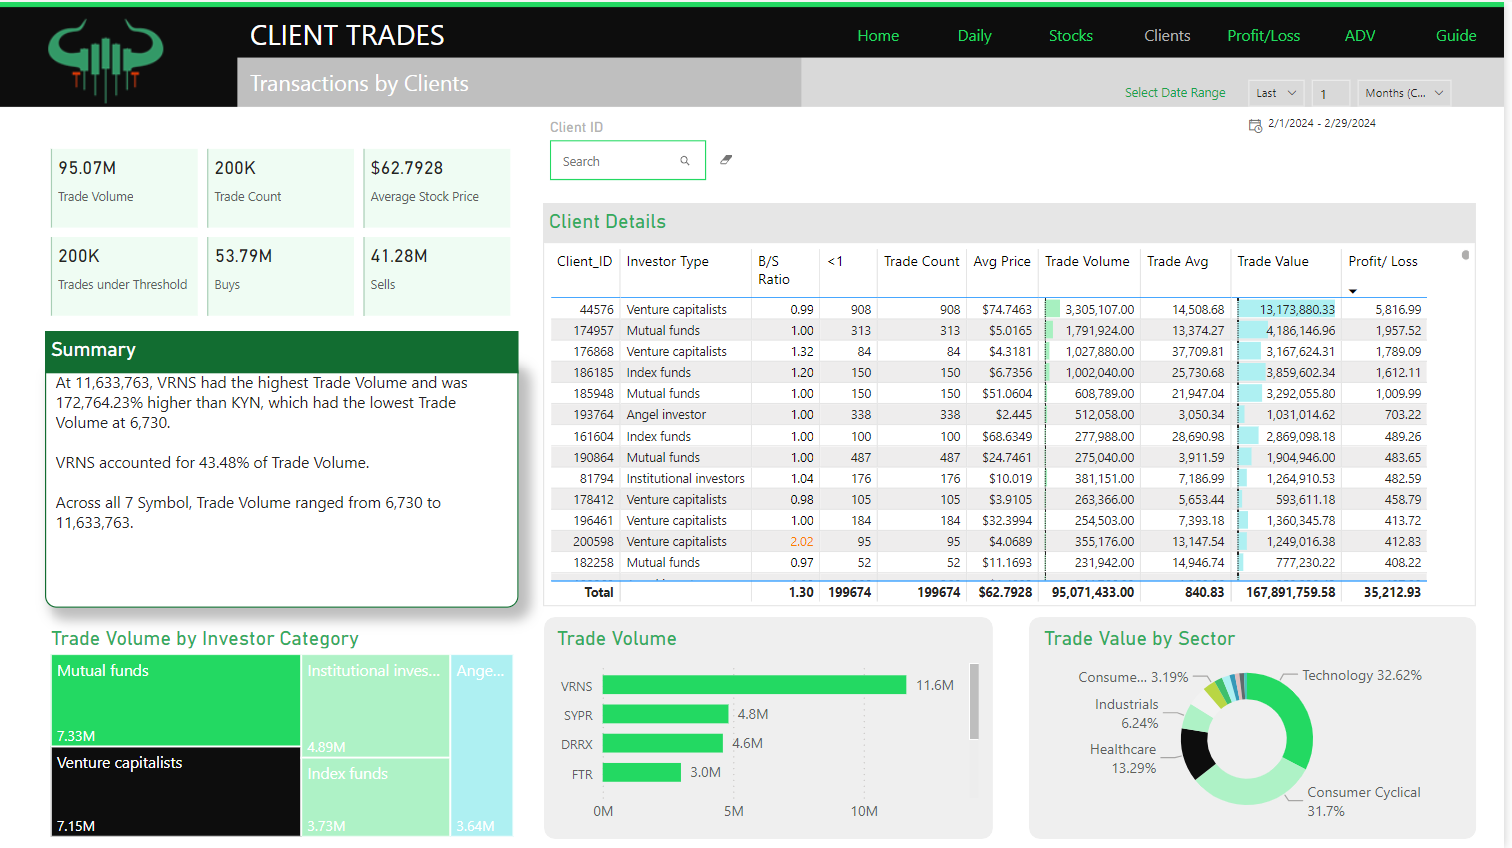
Discover the power of data-driven decision-making with our Stock Trade Monitor Solution, seamlessly integrated with Power BI. Our comprehensive dashboard provides a holistic view of our stock trading operations, leveraging insights from a rich dataset
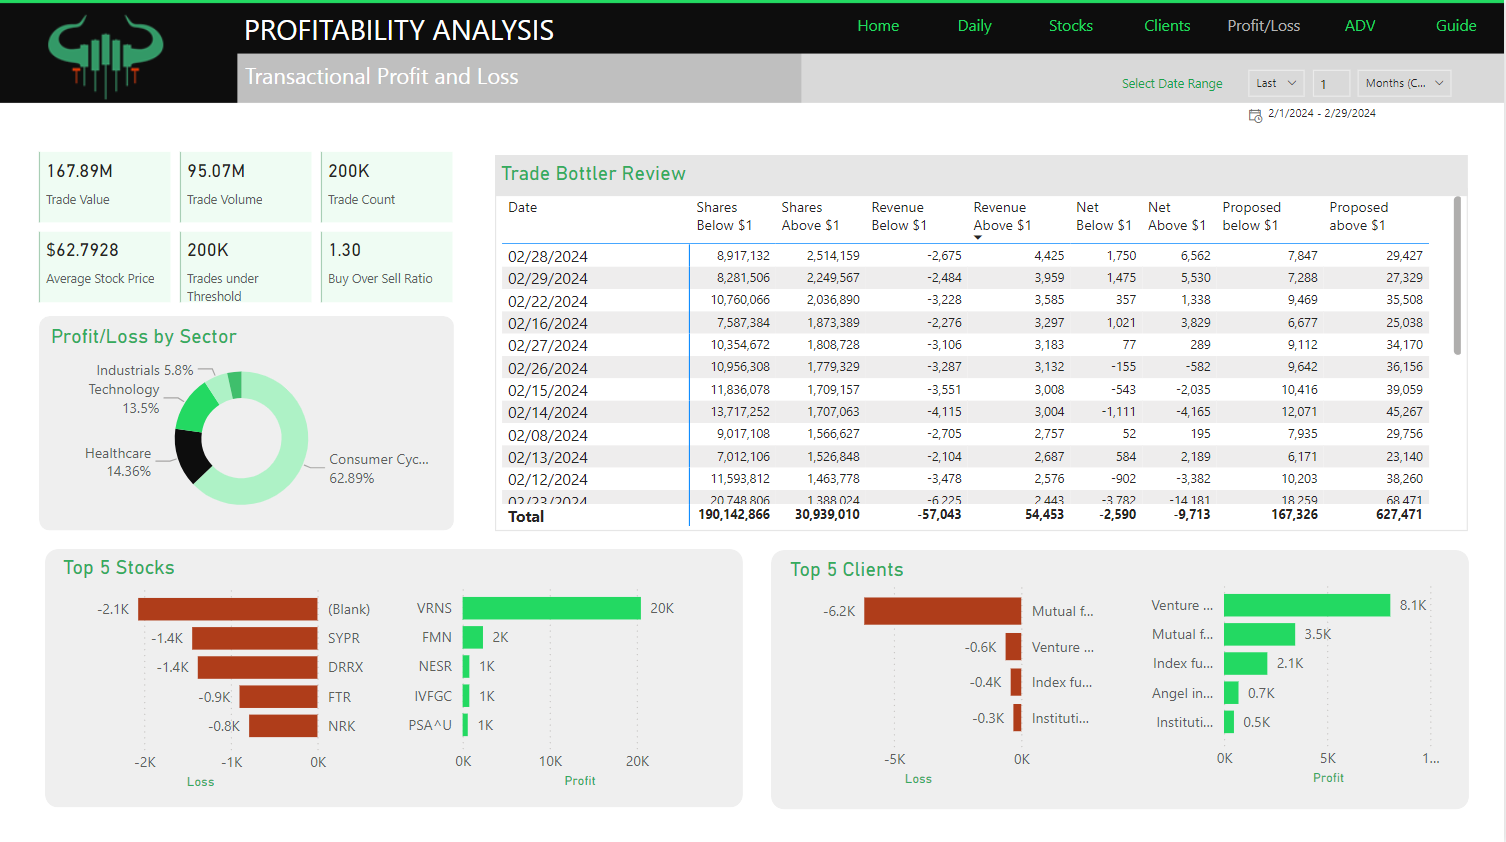
Our dashboard also features visuals for the Top 5 Clients and Stocks, offering a snapshot of the most influential players and trending stocks in our portfolio. Additionally, explore trade volumes over different time slots to understand trading patterns and peak activity periods.
The Buy over Sell ratio offers insights into market sentiment, helping you gauge whether buying or selling trends dominate the trading landscape.
Explore our dashboard snapshots below to see how these key metrics come together to provide a comprehensive view of stock trading performance. Experience the clarity and depth of insights that our Stock Trade Monitor Solution delivers, empowering you to make informed decisions in the dynamic world of stock trading.
Experience the magic of our template app with your own data by installing the app directly into your Power BI service.
The installation link will deploy the template app in your environment. Please see the installation guide for help.
By installing the app you agree with our end-user license terms here