Track, Analyze, and Optimize your Performance with Power BI App across Properties
Unleash the potential of your data
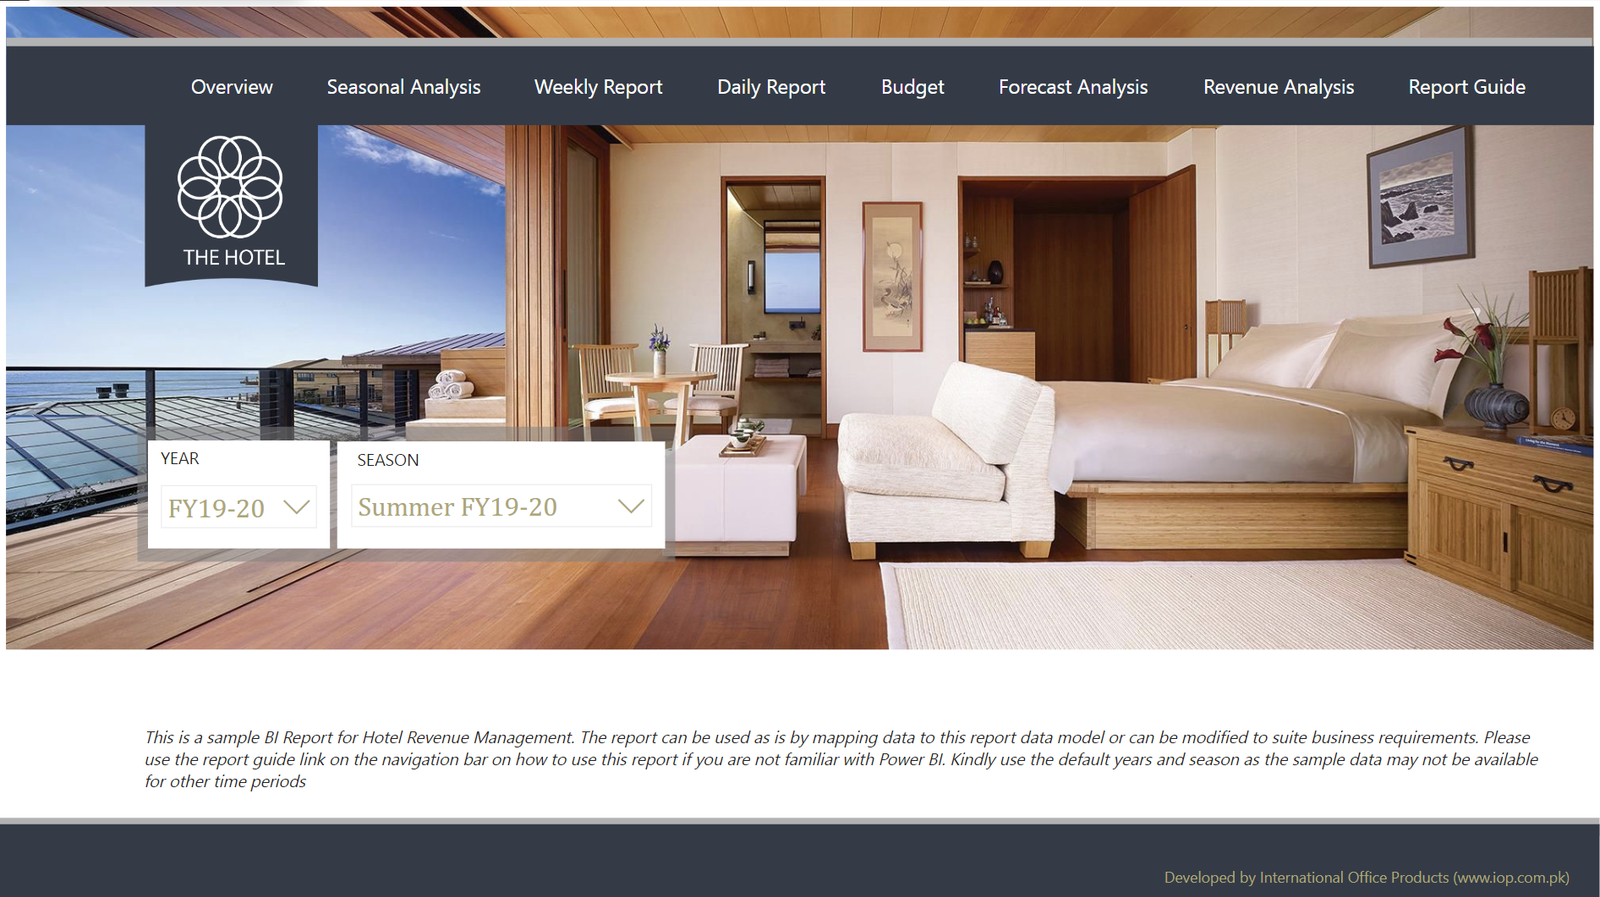
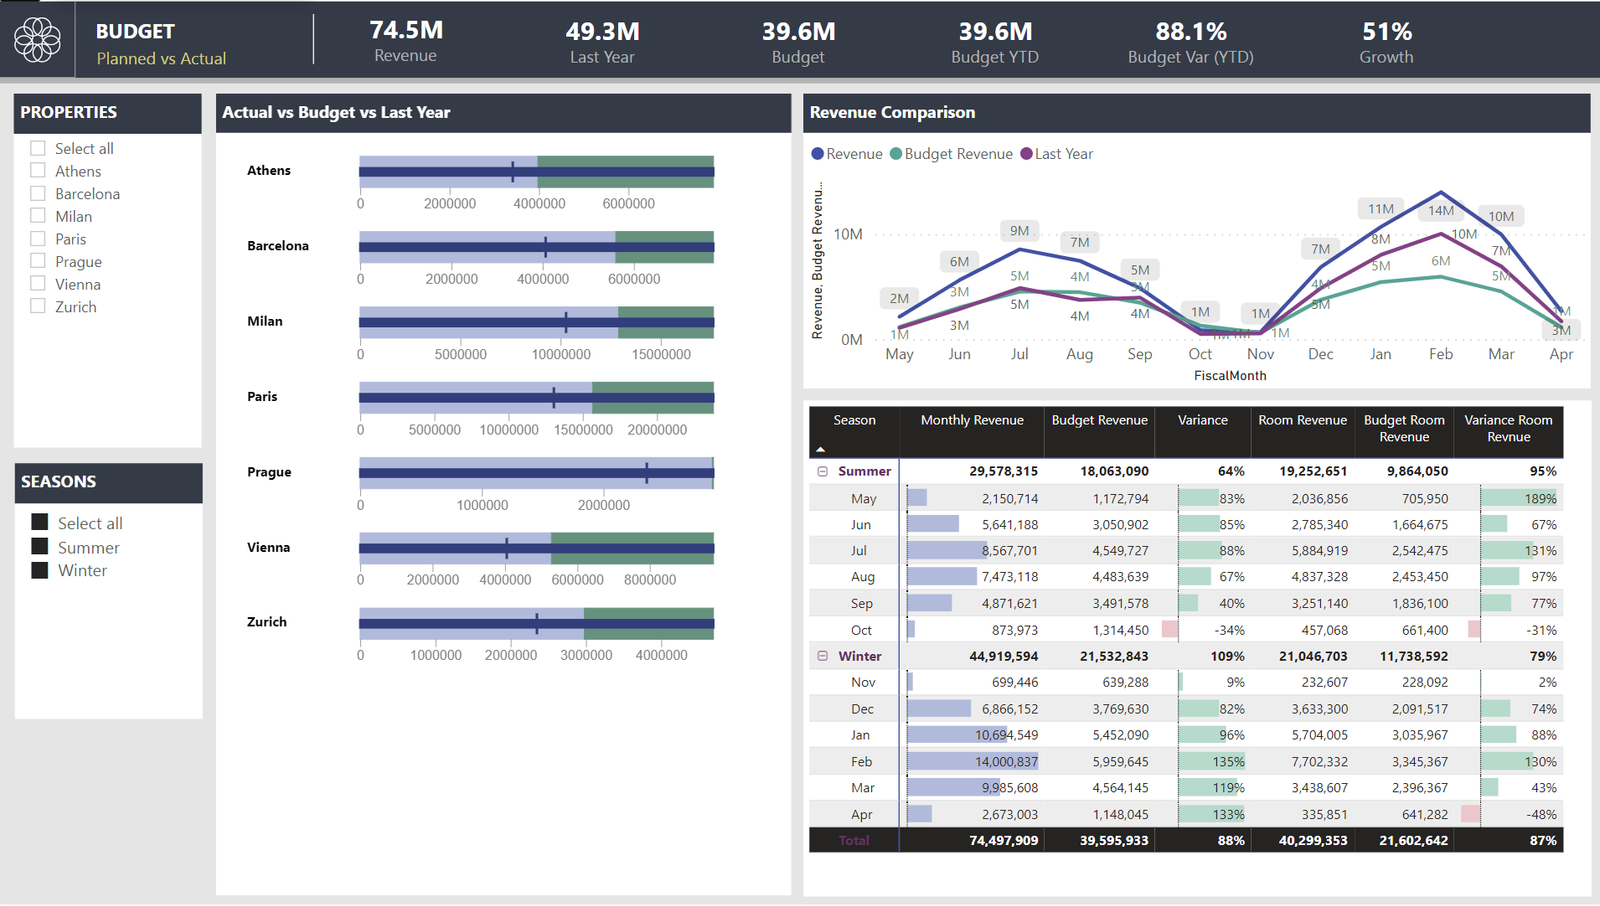
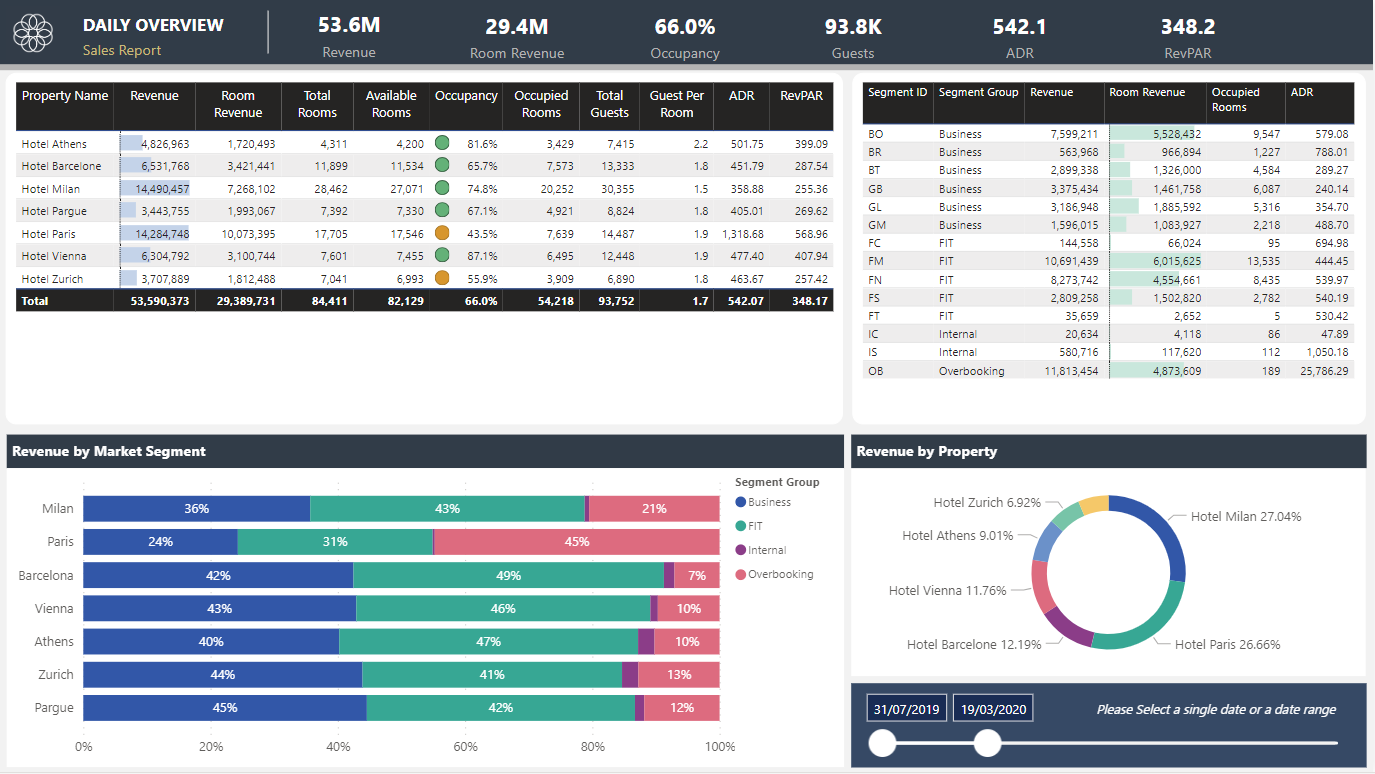
The Dashboard built on Microsoft’s Power BI platform consolidates data for multiple properties under one report and displays key performance indicators (KPIs) related to the revenue and occupancy of multiple hotel properties. The dashboard allows users to compare and analyze data from different sources and to monitor the performance of each property against industry standards and the budget or target goals.
Featured Industry Standard KPIs
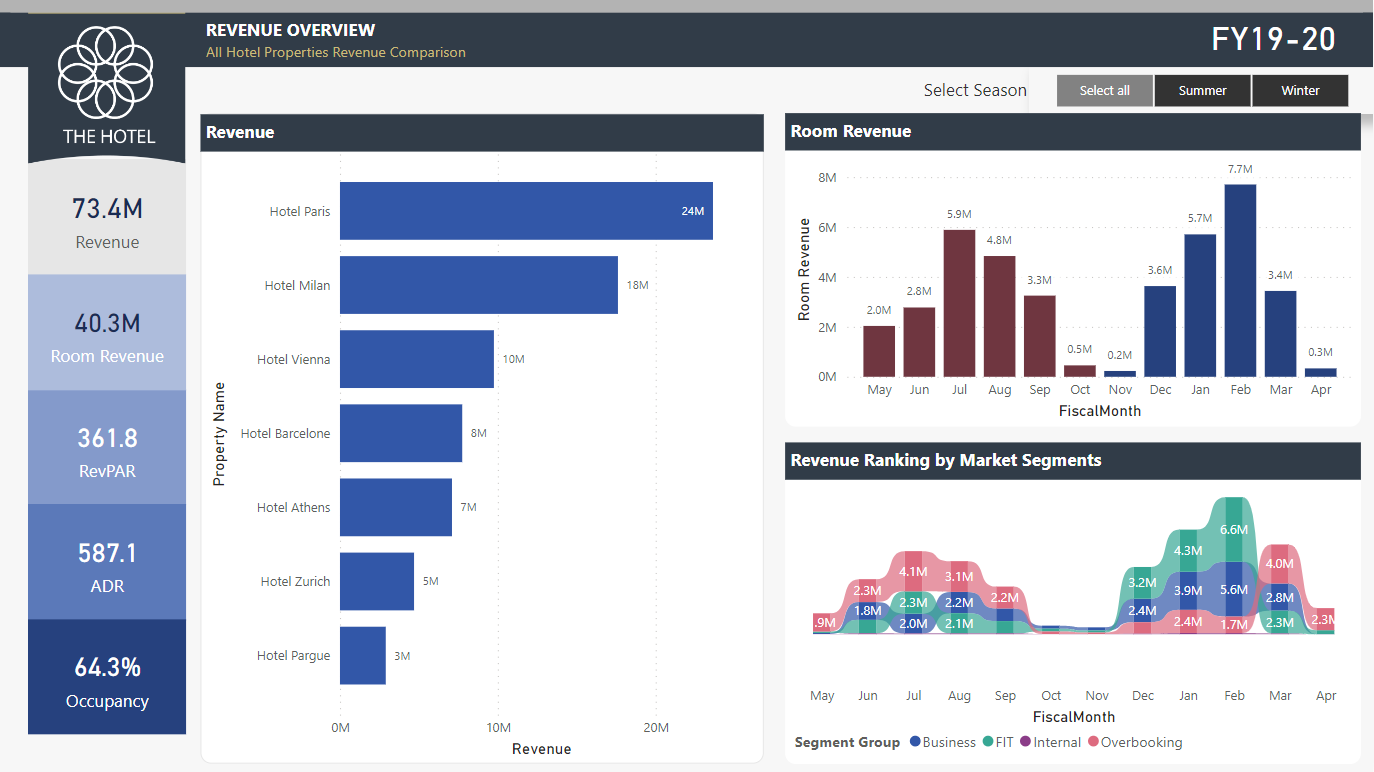
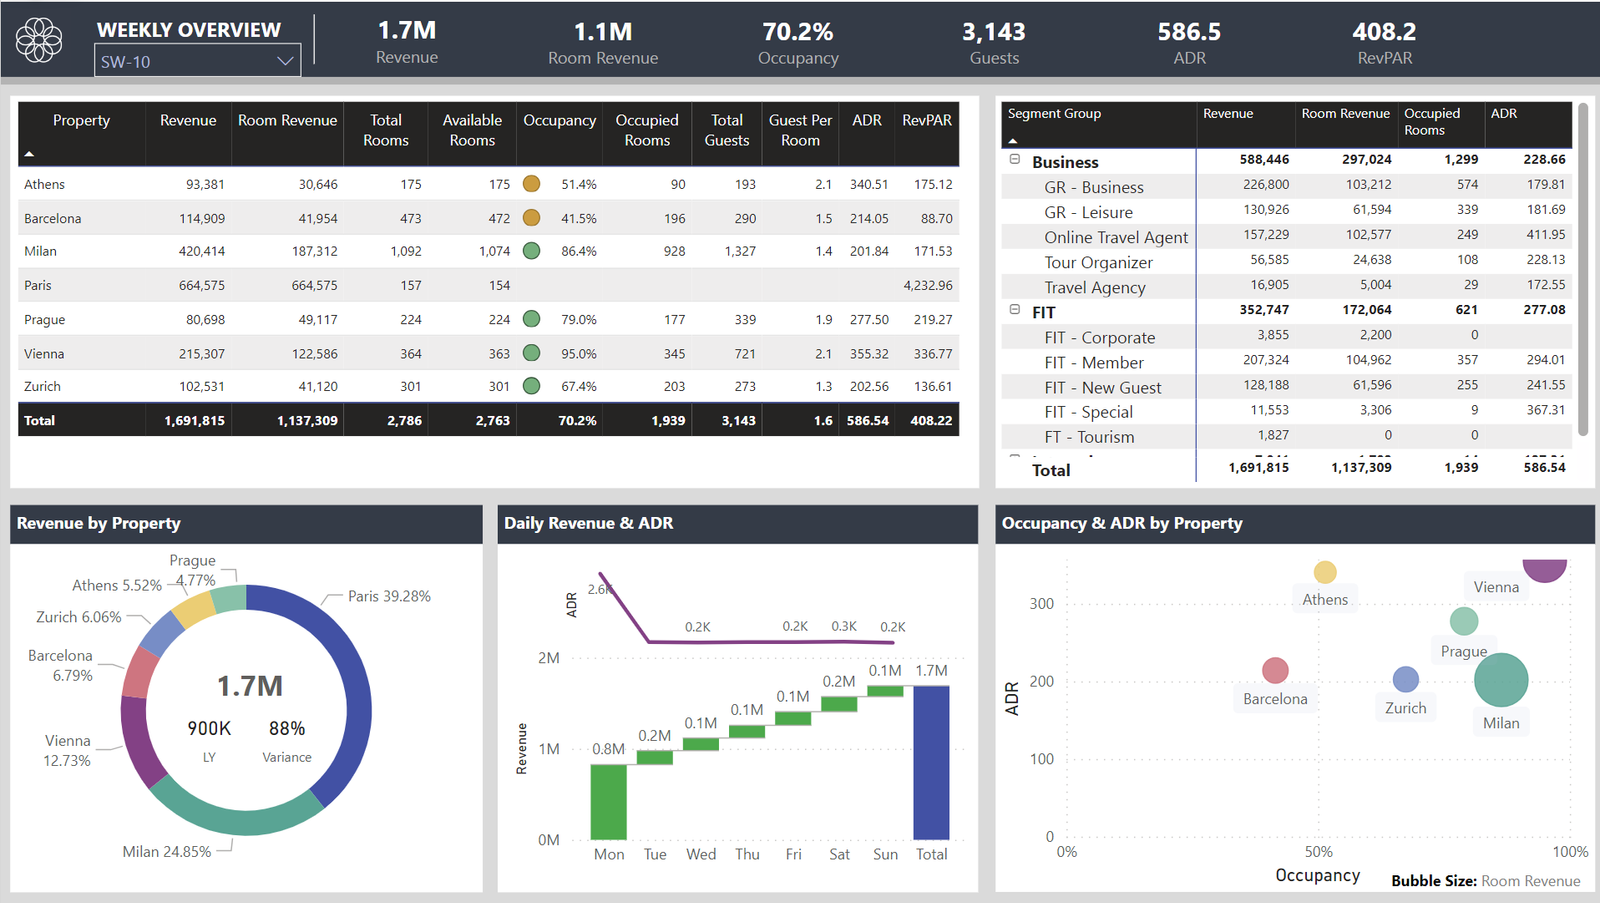
Average Daily Rate (ADR): The average revenue earned per occupied room
Revenue Per Available Room (RevPAR): The total revenue divided by the total number of available rooms
Occupancy Rate (OCC): The percentage of occupied rooms out of the total number of available rooms
• Guest Per Room (GPR): The average number of guests staying in each occupied room
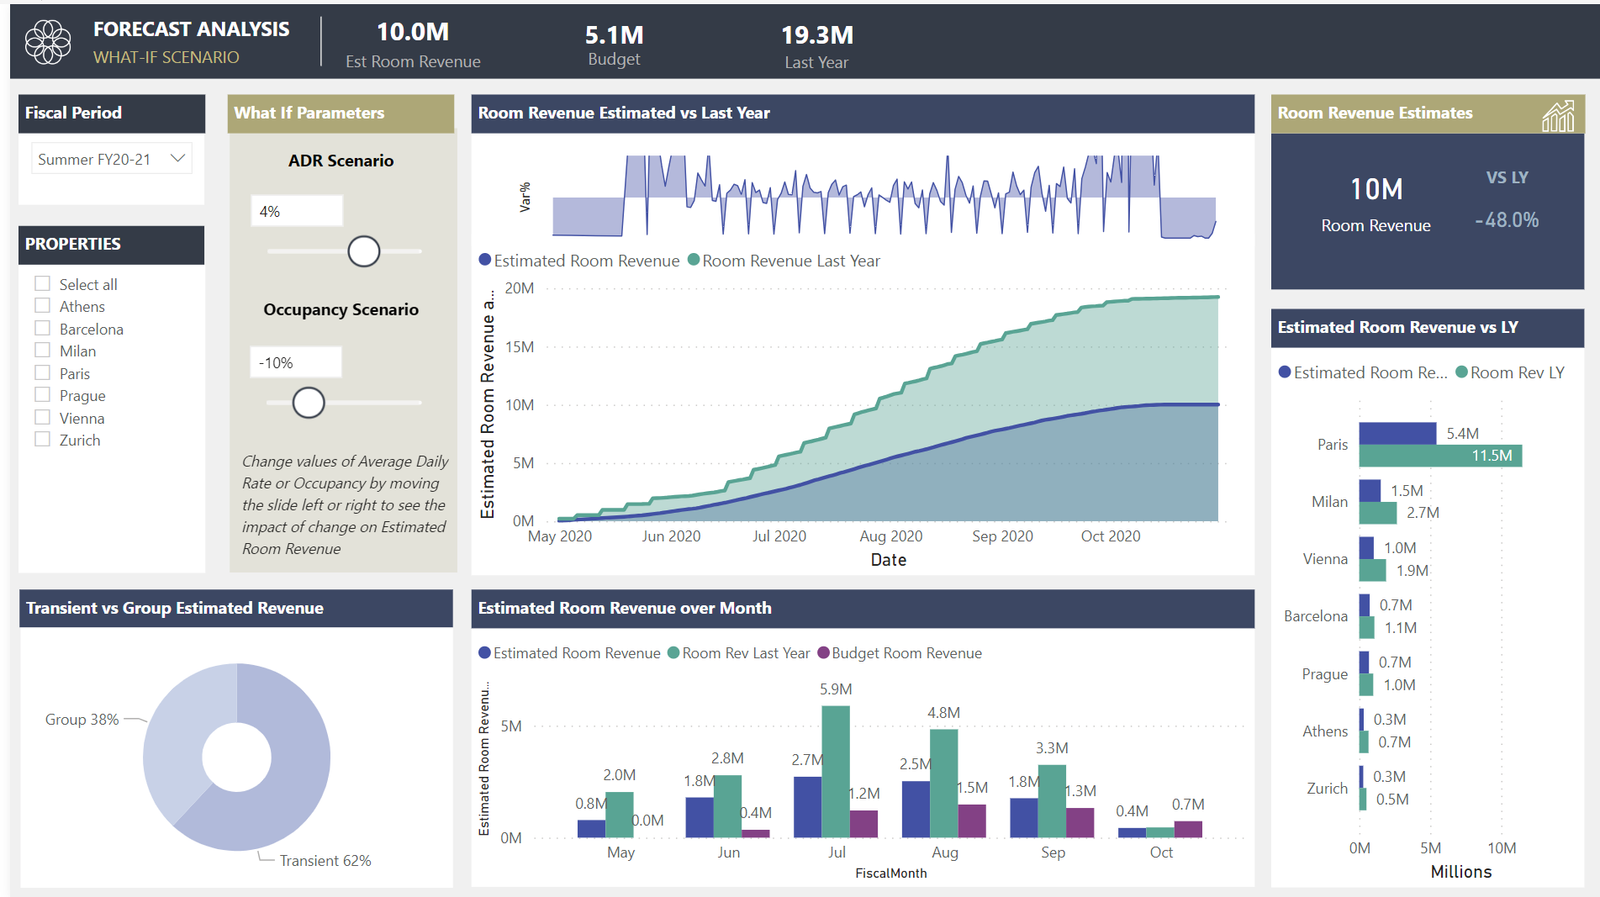
The dashboard can also provide insights into the various guest categories such as Free-Independent-Traveller (FIT), Group, Online Travel Agency (OTA) etc. Additionally, the dashboard can enable users to incorporate the forecast data from respective forecasting tools and run live what-if scenarios on the dashboard to evaluate the impact of different pricing strategies, demand patterns, or market conditions on the revenue and occupancy. The dashboard can also help users to identify the strengths and weaknesses of each property and to optimize the revenue management decisions accordingly.
The solution has been successfully running at a Swiss Hotel Chain and was also part of Microsoft Power BI Showcase.
Experience the magic of our template app with your own data by installing the app directly into your Power BI service.