Streaming Subscription Insights

See how subscribers join, stay, upgrade, and leave.

Master Subscription Churn: Unlock Retention-Driven Growth

This Subscription Churn & Revenue Dashboard is built to mirror a real streaming platform, tracking customers from their very first signup through upgrades, downgrades, churn, and returns. Using a rich subscription history with start and end dates, product tiers, locations, and recurring prices, the report turns raw transaction data into an intuitive view of how your subscriber base and revenue evolve over time. It’s designed for business users who want to understand not just “how many” customers they have, but how those customers behave across their lifecycle.

Key Highlights:

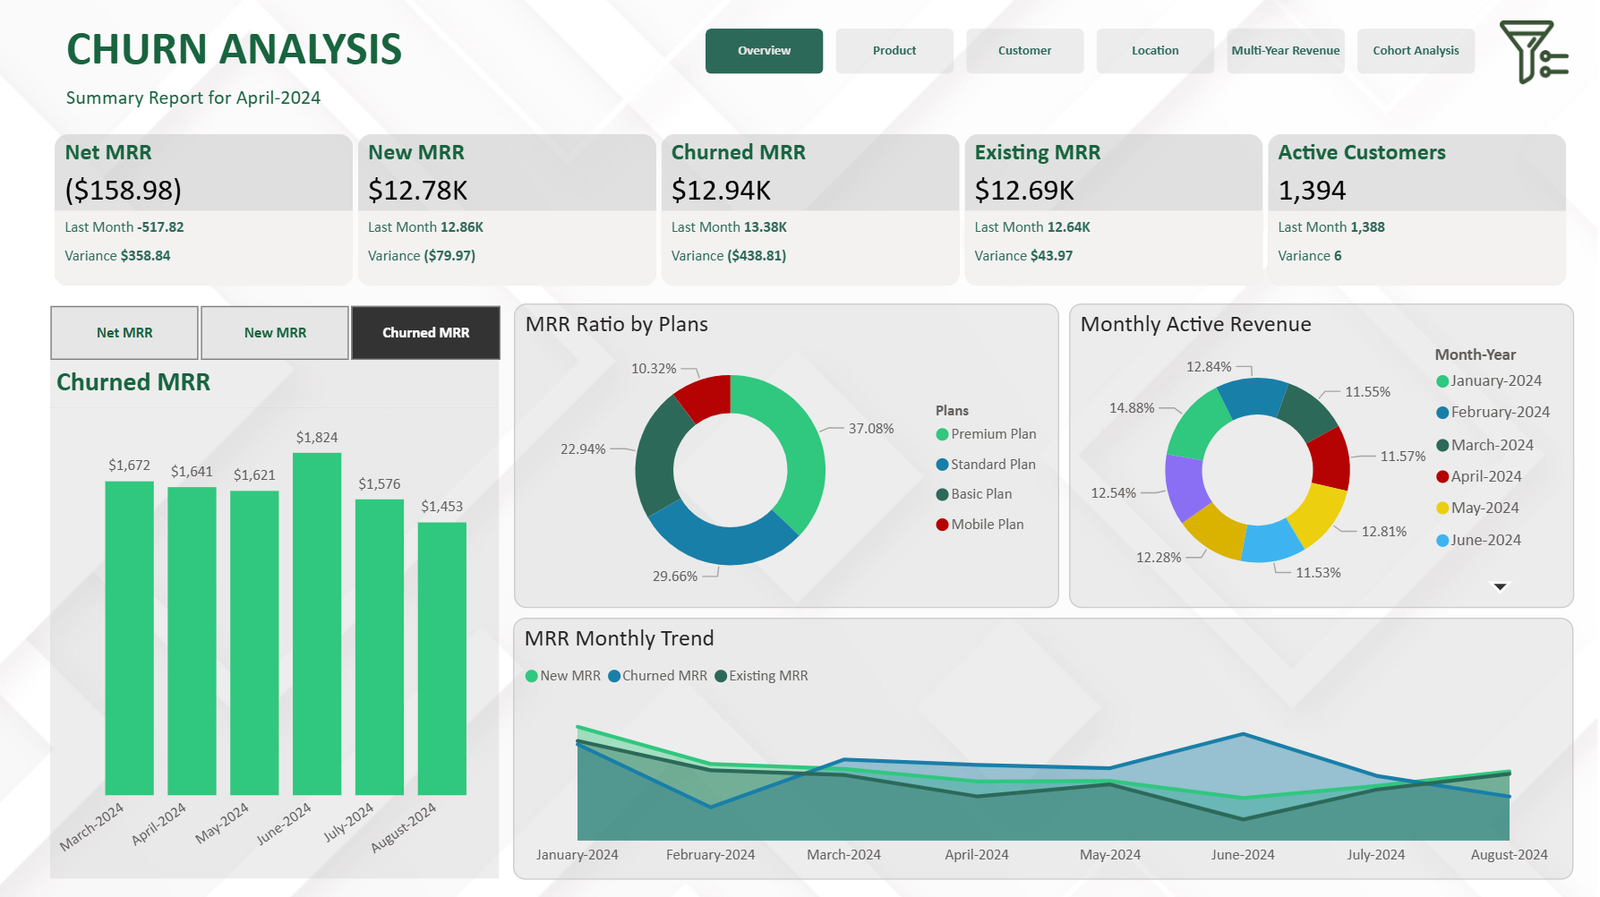
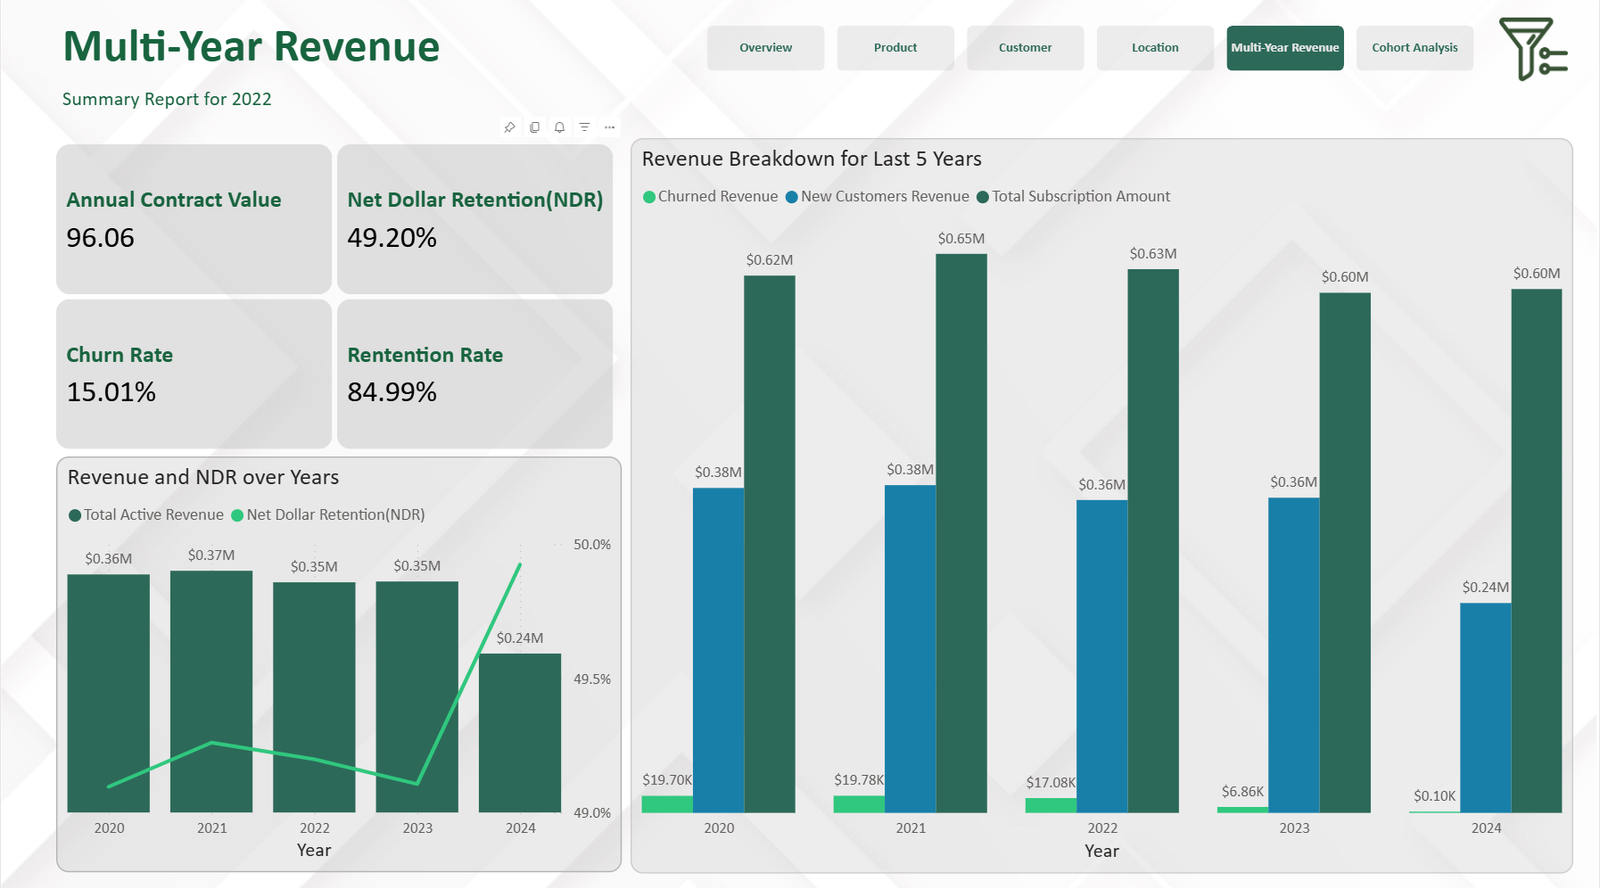
Together, these metrics provide a complete picture of subscription health—who is active, who is leaving, where revenue is growing, and which plans drive the most value. By interacting with filters for time, product, and location, users can drill down from high-level trends into customer-level journeys, uncovering patterns that support smarter decisions on pricing, retention campaigns, and product strategy. This dashboard serves as a practical blueprint for any subscription business looking to manage churn proactively and optimize long-term recurring revenue.


Where every subscription tells a story—and every story guides smarter strategy

Experience the magic of our template app with your own data by installing the app directly into your Power BI service.

Try it with your own Data

The installation link will deploy the template app in your environment. Please see the installation guide for help.

By installing the app you agree with our end-user license terms here